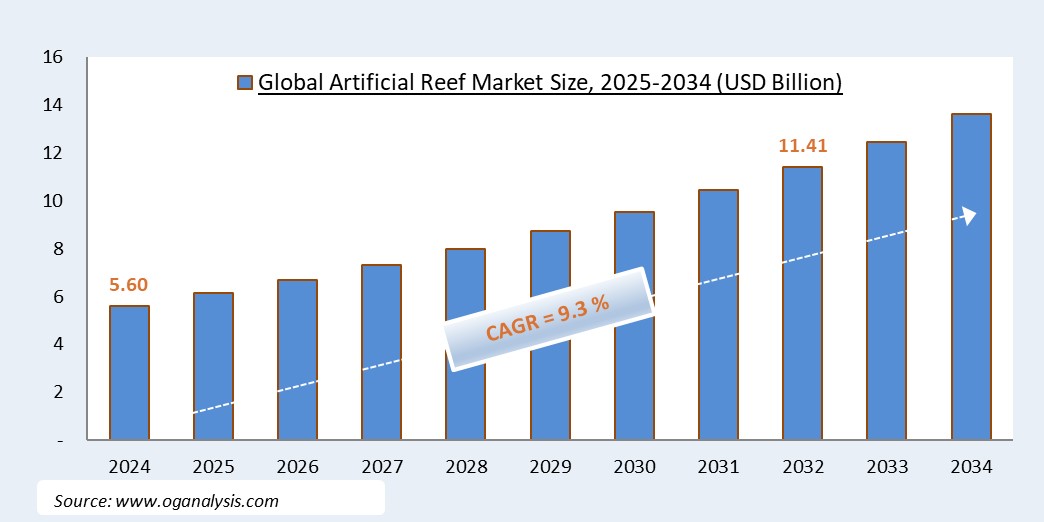
"The Global Artificial Reef Market valued at USD 5.6 billion in 2024, is expected to grow by 9.3% CAGR to reach market size worth USD 14. billion by 2034."
The Artificial Reef market is experiencing a surge in growth as a sustainable solution for marine conservation, coastal protection, and enhancing biodiversity. Artificial reefs are structures intentionally placed on the seabed to mimic natural reefs, providing habitat for marine life, enhancing fishing opportunities, and protecting coastlines from erosion. These structures can be constructed from various materials, including concrete, steel, recycled materials, and even living organisms like coral. 2024 saw notable advancements in artificial reef design and construction, with a focus on creating more resilient and ecologically beneficial structures. The use of 3D printing and other innovative technologies is allowing for the creation of more complex and bio-diverse reefs that better mimic natural environments.
The Artificial Reef market is poised for continued expansion, driven by several factors. The growing awareness of the threats facing natural coral reefs, including climate change, pollution, and overfishing, is leading to a greater emphasis on creating artificial reefs to provide habitat for marine life and protect coastal ecosystems. Furthermore, the increasing demand for sustainable fishing practices and the desire to enhance recreational fishing opportunities are driving the development of artificial reefs that can provide habitat for target fish species and boost populations. 2025 is expected to witness a further acceleration in market growth, fueled by a growing global commitment to marine conservation, increased investment in coastal protection, and the development of more innovative and sustainable artificial reef technologies. As the need to protect and restore marine ecosystems intensifies, the Artificial Reef market is expected to play an increasingly important role in safeguarding the health of our oceans.
The Global Artificial Reef Market Analysis Report will provide a comprehensive assessment of business dynamics, offering detailed insights into how companies can navigate the evolving landscape to maximize their market potential through 2034. This analysis will be crucial for stakeholders aiming to align with the latest industry trends and capitalize on emerging market opportunities.
Artificial Reef Market Strategy, Price Trends, Drivers, Challenges and Opportunities to 2034
In terms of market strategy, price trends, drivers, challenges, and opportunities from2025 to 2034, Artificial Reef market players are directing investments toward acquiring new technologies, securing raw materials through efficient procurement and inventory management, enhancing product portfolios, and leveraging capabilities to sustain growth amidst challenging conditions. Regional-specific strategies are being emphasized due to highly varying economic and social challenges across countries.
Factors such as global economic slowdown, the impact of geopolitical tensions, delayed growth in specific regions, and the risks of stagflation necessitate a vigilant and forward-looking approach among Artificial Reef industry players. Adaptations in supply chain dynamics and the growing emphasis on cleaner and sustainable practices further drive strategic shifts within companies.
The market study delivers a comprehensive overview of current trends and developments in the Artificial Reef industry, complemented by detailed descriptive and prescriptive analyses for insights into the market landscape until 2034.
North America Artificial Reef Market Analysis
The North America Artificial Reef market exhibited robust developments in 2024, driven by advancements in precision agriculture, sustainable farming practices, and the adoption of cutting-edge technologies such as AI and robotics in agriculture. Key trends include a shift toward biological solutions like agricultural microbial and biopolymers, along with growing demand for connected agriculture platforms. Anticipated growth from 2025 is underpinned by increased government incentives promoting eco-friendly practices, the rising focus on food security, and enhanced technological integration across farming operations. The competitive landscape is marked by significant investments in R&D by leading players and strategic collaborations to develop innovative solutions. Companies leveraging AI, bioplastics, and agrochemical CDMO services are poised to gain a competitive edge, addressing evolving consumer and regulatory demands for sustainable agricultural practices.
Europe Artificial Reef Market Outlook
In 2024, the Europe Artificial Reef market witnessed accelerated developments in sustainable agriculture, with a notable emphasis on bioplastics, probiotics in animal feed, and aquaponics. These advancements align with stringent EU regulations promoting eco-friendly solutions and reducing chemical inputs. From 2025, the market is expected to see significant growth fueled by policy-driven innovation, growing consumer preference for organic products, and increased adoption of artificial intelligence in agriculture. The competitive landscape is characterized by a strong presence of regional players and cross-border collaborations aimed at advancing biological solutions and connected agriculture technologies. Innovations in agricultural packaging and the deployment of self-loading feed mixers further reinforce the region’s push toward sustainability and efficiency.
Asia-Pacific Artificial Reef Market Forecast
Asia-Pacific’s Artificial Reef market expanded significantly in 2024, driven by increasing investments in agricultural robotics, aquaponics, and microbial-based solutions to meet the rising food demand and combat resource constraints. Growth prospects from 2025 are bolstered by advancements in connected agriculture technologies, expanding government initiatives to modernize farming, and heightened focus on climate-resilient farming practices. The competitive landscape reveals a dynamic interplay of multinational corporations and emerging startups, particularly in markets like artificial intelligence in agriculture and agrochemical CDMO services. Players prioritizing scalability, cost-efficiency, and sustainable practices are likely to capitalize on the region's growing appetite for agricultural innovation.
Middle East, Africa, Latin America (RoW) Artificial Reef Market
The Middle East, Africa, Latin America Artificial Reef market demonstrated promising progress in 2024, with rising adoption of sustainable farming practices in regions like the Middle East, Africa, and South America. Key developments include the growing penetration of agricultural biologicals, artificial reefs for ecosystem restoration, and sea buckthorn cultivation for nutraceutical applications. Anticipated growth from 2025 is supported by increasing international funding for agri-tech solutions, burgeoning interest in aquaponics, and expanding agricultural trade networks. The competitive landscape features a mix of local innovators and global players leveraging region-specific strategies to address resource constraints and enhance productivity. Investments in AI-driven agriculture, bioplastics, and advanced feed solutions are expected to drive market expansion in underserved regions.
Artificial Reef Market Dynamics and Future Analytics
The research analyses the Artificial Reef parent market, derived market, intermediaries’ market, raw material market, and substitute market are all evaluated to better prospect the Artificial Reef market outlook. Geopolitical analysis, demographic analysis, and Porter’s five forces analysis are prudently assessed to estimate the best Artificial Reef market projections.
Recent deals and developments are considered for their potential impact on Artificial Reef's future business. Other metrics analyzed include the Threat of New Entrants, Threat of New Substitutes, Product Differentiation, Degree of Competition, Number of Suppliers, Distribution Channel, Capital Needed, Entry Barriers, Govt. Regulations, Beneficial Alternative, and Cost of Substitute in Artificial Reef market.
Artificial Reef trade and price analysis helps comprehend Artificial Reef's international market scenario with top exporters/suppliers and top importers/customer information. The data and analysis assist our clients in planning procurement, identifying potential vendors/clients to associate with, understanding Artificial Reef price trends and patterns, and exploring new Artificial Reef sales channels. The research will be updated to the latest month to include the impact of the latest developments such as the Russia-Ukraine war on the Artificial Reef market.
Artificial Reef Market Structure, Competitive Intelligence and Key Winning Strategies
The report presents detailed profiles of top companies operating in the Artificial Reef market and players serving the Artificial Reef value chain along with their strategies for the near, medium, and long term period.
OGAnalysis’ proprietary company revenue and product analysis model unveils the Artificial Reef market structure and competitive landscape. Company profiles of key players with a business description, product portfolio, SWOT analysis, Financial Analysis, and key strategies are covered in the report. It identifies top-performing Artificial Reef products in global and regional markets. New Product Launches, Investment & Funding updates, Mergers & Acquisitions, Collaboration & Partnership, Awards and Agreements, Expansion, and other developments give our clients the Artificial Reef market update to stay ahead of the competition.
Company offerings in different segments across Asia-Pacific, Europe, the Middle East, Africa, and South and Central America are presented to better understand the company strategy for the Artificial Reef market. The competition analysis enables users to assess competitor strategies and helps align their capabilities and resources for future growth prospects to improve their market share.
Artificial Reef Market Research Scope
• Global Artificial Reef market size and growth projections (CAGR), 2024- 2034
• Policies of USA New President Trump, Russia-Ukraine War, Israel-Palestine, Middle East Tensions Impact on the Artificial Reef Trade and Supply-chain
• Artificial Reef market size, share, and outlook across 5 regions and 27 countries, 2023- 2034
• Artificial Reef market size, CAGR, and Market Share of key products, applications, and end-user verticals, 2023- 2034
• Short and long-term Artificial Reef market trends, drivers, restraints, and opportunities
• Porter’s Five Forces analysis, Technological developments in the Artificial Reef market, Artificial Reef supply chain analysis
• Artificial Reef trade analysis, Artificial Reef market price analysis, Artificial Reef supply/demand
• Profiles of 5 leading companies in the industry- overview, key strategies, financials, and products
• Latest Artificial Reef market news and developments
The Artificial Reef Market international scenario is well established in the report with separate chapters on North America Artificial Reef Market, Europe Artificial Reef Market, Asia-Pacific Artificial Reef Market, Middle East and Africa Artificial Reef Market, and South and Central America Artificial Reef Markets. These sections further fragment the regional Artificial Reef market by type, application, end-user, and country.
Regional Insights
North America Artificial Reef market data and outlook to 2034
United States
Canada
Mexico
Europe Artificial Reef market data and outlook to 2034
Germany
United Kingdom
France
Italy
Spain
BeNeLux
Russia
Asia-Pacific Artificial Reef market data and outlook to 2034
China
Japan
India
South Korea
Australia
Indonesia
Malaysia
Vietnam
Middle East and Africa Artificial Reef market data and outlook to 2034
Saudi Arabia
South Africa
Iran
UAE
Egypt
South and Central America Artificial Reef market data and outlook to 2034
Brazil
Argentina
Chile
Peru
* We can include data and analysis of additional coutries on demand
Who can benefit from this research
The research would help top management/strategy formulators/business/product development/sales managers and investors in this market in the following ways
1. The report provides 2024 Artificial Reef market sales data at the global, regional, and key country levels with a detailed outlook to 2034 allowing companies to calculate their market share and analyze prospects, uncover new markets, and plan market entry strategy.
2. The research includes the Artificial Reef market split into different types and applications. This segmentation helps managers plan their products and budgets based on the future growth rates of each segment
3. The Artificial Reef market study helps stakeholders understand the breadth and stance of the market giving them information on key drivers, restraints, challenges, and growth opportunities of the market and mitigating risks
4. This report would help top management understand competition better with a detailed SWOT analysis and key strategies of their competitors, and plan their position in the business
5. The study assists investors in analyzing Artificial Reef business prospects by region, key countries, and top companies' information to channel their investments.
Available Customizations
The standard syndicate report is designed to serve the common interests of Artificial Reef Market players across the value chain and include selective data and analysis from entire research findings as per the scope and price of the publication.
However, to precisely match the specific research requirements of individual clients, we offer several customization options to include the data and analysis of interest in the final deliverable.
Some of the customization requests are as mentioned below –
Segmentation of choice – Our clients can seek customization to modify/add a market division for types/applications/end-uses/processes of their choice.
Artificial Reef Pricing and Margins Across the Supply Chain, Artificial Reef Price Analysis / International Trade Data / Import-Export Analysis,
Supply Chain Analysis, Supply – Demand Gap Analysis, PESTLE Analysis, Macro-Economic Analysis, and other Artificial Reef market analytics
Processing and manufacturing requirements, Patent Analysis, Technology Trends, and Product Innovations
Further, the client can seek customization to break down geographies as per their requirements for specific countries/country groups such as South East Asia, Central Asia, Emerging and Developing Asia, Western Europe, Eastern Europe, Benelux, Emerging and Developing Europe, Nordic countries, North Africa, Sub-Saharan Africa, Caribbean, The Middle East and North Africa (MENA), Gulf Cooperation Council (GCC) or any other.
Capital Requirements, Income Projections, Profit Forecasts, and other parameters to prepare a detailed project report to present to Banks/Investment Agencies.
Customization of up to 10% of the content can be done without any additional charges.
Note: Latest developments will be updated in the report and delivered within 2 to 3 working days
1. Table of Contents
1.1 List of Tables
1.2 List of Figures
2. Global Artificial Reef Market Review, 2024
2.1 Artificial Reef Industry Overview
2.2 Research Methodology
3. Artificial Reef Market Insights
3.1 Artificial Reef Market Trends to 2034
3.2 Future Opportunities in Artificial Reef Market
3.3 Dominant Applications of Artificial Reef, 2024 Vs 2034
3.4 Key Types of Artificial Reef, 2024 Vs 2034
3.5 Leading End Uses of Artificial Reef Market, 2024 Vs 2034
3.6 High Prospect Countries for Artificial Reef Market, 2024 Vs 2034
4. Artificial Reef Market Trends, Drivers, and Restraints
4.1 Latest Trends and Recent Developments in Artificial Reef Market
4.2 Key Factors Driving the Artificial Reef Market Growth
4.2 Major Challenges to the Artificial Reef industry, 2025- 2034
4.3 Impact of Wars and geo-political tensions on Artificial Reef supply chain
5 Five Forces Analysis for Global Artificial Reef Market
5.1 Artificial Reef Industry Attractiveness Index, 2024
5.2 Artificial Reef Market Threat of New Entrants
5.3 Artificial Reef Market Bargaining Power of Suppliers
5.4 Artificial Reef Market Bargaining Power of Buyers
5.5 Artificial Reef Market Intensity of Competitive Rivalry
5.6 Artificial Reef Market Threat of Substitutes
6. Global Artificial Reef Market Data – Industry Size, Share, and Outlook
6.1 Artificial Reef Market Annual Sales Outlook, 2025- 2034 ($ Million)
6.1 Global Artificial Reef Market Annual Sales Outlook by Type, 2025- 2034 ($ Million)
6.2 Global Artificial Reef Market Annual Sales Outlook by Application, 2025- 2034 ($ Million)
6.3 Global Artificial Reef Market Annual Sales Outlook by End-User, 2025- 2034 ($ Million)
6.4 Global Artificial Reef Market Annual Sales Outlook by Region, 2025- 2034 ($ Million)
7. Asia Pacific Artificial Reef Industry Statistics – Market Size, Share, Competition and Outlook
7.1 Asia Pacific Market Insights, 2024
7.2 Asia Pacific Artificial Reef Market Revenue Forecast by Type, 2025- 2034 (USD Million)
7.3 Asia Pacific Artificial Reef Market Revenue Forecast by Application, 2025- 2034(USD Million)
7.4 Asia Pacific Artificial Reef Market Revenue Forecast by End-User, 2025- 2034 (USD Million)
7.5 Asia Pacific Artificial Reef Market Revenue Forecast by Country, 2025- 2034 (USD Million)
7.5.1 China Artificial Reef Analysis and Forecast to 2034
7.5.2 Japan Artificial Reef Analysis and Forecast to 2034
7.5.3 India Artificial Reef Analysis and Forecast to 2034
7.5.4 South Korea Artificial Reef Analysis and Forecast to 2034
7.5.5 Australia Artificial Reef Analysis and Forecast to 2034
7.5.6 Indonesia Artificial Reef Analysis and Forecast to 2034
7.5.7 Malaysia Artificial Reef Analysis and Forecast to 2034
7.5.8 Vietnam Artificial Reef Analysis and Forecast to 2034
7.6 Leading Companies in Asia Pacific Artificial Reef Industry
8. Europe Artificial Reef Market Historical Trends, Outlook, and Business Prospects
8.1 Europe Key Findings, 2024
8.2 Europe Artificial Reef Market Size and Percentage Breakdown by Type, 2025- 2034 (USD Million)
8.3 Europe Artificial Reef Market Size and Percentage Breakdown by Application, 2025- 2034 (USD Million)
8.4 Europe Artificial Reef Market Size and Percentage Breakdown by End-User, 2025- 2034 (USD Million)
8.5 Europe Artificial Reef Market Size and Percentage Breakdown by Country, 2025- 2034 (USD Million)
8.5.1 2024 Germany Artificial Reef Market Size and Outlook to 2034
8.5.2 2024 United Kingdom Artificial Reef Market Size and Outlook to 2034
8.5.3 2024 France Artificial Reef Market Size and Outlook to 2034
8.5.4 2024 Italy Artificial Reef Market Size and Outlook to 2034
8.5.5 2024 Spain Artificial Reef Market Size and Outlook to 2034
8.5.6 2024 BeNeLux Artificial Reef Market Size and Outlook to 2034
8.5.7 2024 Russia Artificial Reef Market Size and Outlook to 2034
8.6 Leading Companies in Europe Artificial Reef Industry
9. North America Artificial Reef Market Trends, Outlook, and Growth Prospects
9.1 North America Snapshot, 2024
9.2 North America Artificial Reef Market Analysis and Outlook by Type, 2025- 2034($ Million)
9.3 North America Artificial Reef Market Analysis and Outlook by Application, 2025- 2034($ Million)
9.4 North America Artificial Reef Market Analysis and Outlook by End-User, 2025- 2034($ Million)
9.5 North America Artificial Reef Market Analysis and Outlook by Country, 2025- 2034($ Million)
9.5.1 United States Artificial Reef Market Analysis and Outlook
9.5.2 Canada Artificial Reef Market Analysis and Outlook
9.5.3 Mexico Artificial Reef Market Analysis and Outlook
9.6 Leading Companies in North America Artificial Reef Business
10. Latin America Artificial Reef Market Drivers, Challenges, and Growth Prospects
10.1 Latin America Snapshot, 2024
10.2 Latin America Artificial Reef Market Future by Type, 2025- 2034($ Million)
10.3 Latin America Artificial Reef Market Future by Application, 2025- 2034($ Million)
10.4 Latin America Artificial Reef Market Future by End-User, 2025- 2034($ Million)
10.5 Latin America Artificial Reef Market Future by Country, 2025- 2034($ Million)
10.5.1 Brazil Artificial Reef Market Analysis and Outlook to 2034
10.5.2 Argentina Artificial Reef Market Analysis and Outlook to 2034
10.5.3 Chile Artificial Reef Market Analysis and Outlook to 2034
10.6 Leading Companies in Latin America Artificial Reef Industry
11. Middle East Africa Artificial Reef Market Outlook and Growth Prospects
11.1 Middle East Africa Overview, 2024
11.2 Middle East Africa Artificial Reef Market Statistics by Type, 2025- 2034 (USD Million)
11.3 Middle East Africa Artificial Reef Market Statistics by Application, 2025- 2034 (USD Million)
11.4 Middle East Africa Artificial Reef Market Statistics by End-User, 2025- 2034 (USD Million)
11.5 Middle East Africa Artificial Reef Market Statistics by Country, 2025- 2034 (USD Million)
11.5.1 South Africa Artificial Reef Market Outlook
11.5.2 Egypt Artificial Reef Market Outlook
11.5.3 Saudi Arabia Artificial Reef Market Outlook
11.5.4 Iran Artificial Reef Market Outlook
11.5.5 UAE Artificial Reef Market Outlook
11.6 Leading Companies in Middle East Africa Artificial Reef Business
12. Artificial Reef Market Structure and Competitive Landscape
12.1 Key Companies in Artificial Reef Business
12.2 Artificial Reef Key Player Benchmarking
12.3 Artificial Reef Product Portfolio
12.4 Financial Analysis
12.5 SWOT and Financial Analysis Review
14. Latest News, Deals, and Developments in Artificial Reef Market
14.1 Artificial Reef trade export, import value and price analysis
15 Appendix
15.1 Publisher Expertise
15.2 Artificial Reef Industry Report Sources and Methodology
Get Free Sample
At OG Analysis, we understand the importance of informed decision-making in today's dynamic business landscape. To help you experience the depth and quality of our market research reports, we offer complimentary samples tailored to your specific needs.
Start Now! Please fill the form below for your free sample.
Why Request a Free Sample?
Evaluate Our Expertise: Our reports are crafted by industry experts and seasoned analysts. Requesting a sample allows you to assess the depth of research and the caliber of insights we provide.
Tailored to Your Needs: Let us know your industry, market segment, or specific topic of interest. Our free samples are customized to ensure relevance to your business objectives.
Witness Actionable Insights: See firsthand how our reports go beyond data, offering actionable insights and strategic recommendations that can drive your business forward.
Embark on your journey towards strategic decision-making by requesting a free sample from OG Analysis. Experience the caliber of insights that can transform the way you approach your business challenges.
FAQ's
The Global Artificial Reef Market is estimated to generate USD 6.1 billion in revenue in 2025
The Global Artificial Reef Market is expected to grow at a Compound Annual Growth Rate (CAGR) of 9.3% during the forecast period from 2025 to 2034.
The Artificial Reef Market is estimated to reach USD 14.0 billion by 2034.
Didn’t find what you’re looking for? TALK TO OUR ANALYST TEAM
Need something within your budget? NO WORRIES! WE GOT YOU COVERED!