Global Ceramic Tiles Market Outlook Report: Latest Trends and Growth Opportunities by Region

Published On: Feb, 2025
|
Pages: 158

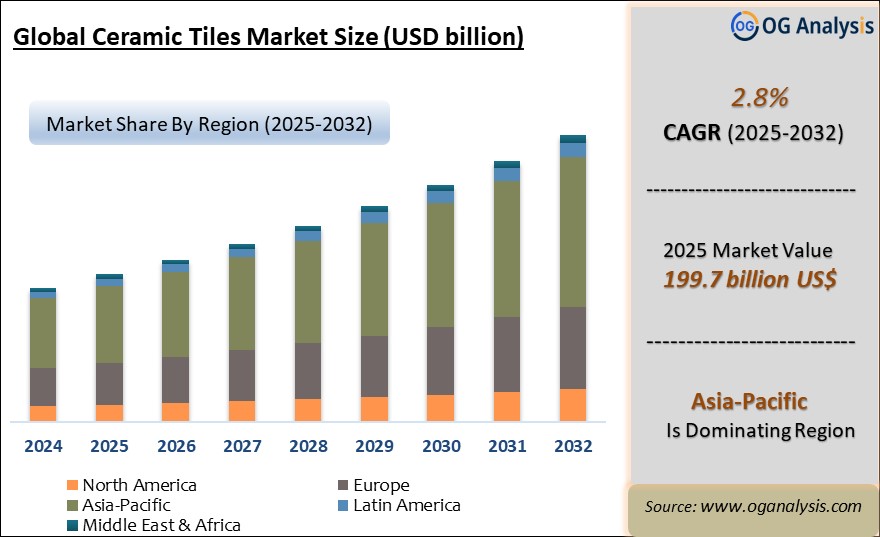
"The Global Ceramic Tiles Market Size was valued at USD 195.0 billion in 2024 and is projected to reach USD 199.7 billion in 2025. Worldwide sales of Ceramic Tiles are expected to grow at a significant CAGR of 2.8%, reaching USD 259.8 billion by the end of the forecast period in 2034."

Introduction and Overview

The global ceramic tiles market has witnessed substantial growth over the past decade, driven by increasing urbanization and rising disposable incomes. Ceramic tiles, known for their durability, aesthetic appeal, and low maintenance requirements, have become a popular choice in both residential and commercial settings. This market encompasses various types of ceramic tiles, including floor, wall, and decorative tiles, which are utilized in diverse applications from flooring and countertops to backsplash and exterior facades. The versatility of ceramic tiles, combined with advancements in technology that allow for intricate designs and improved performance, has bolstered their demand worldwide.

Geographically, Asia-Pacific dominates the ceramic tiles market due to rapid industrialization and urban growth in countries like China and India. However, regions such as North America and Europe are also experiencing steady growth, driven by renovations and new construction projects. The market is characterized by a competitive landscape with numerous global and regional players, leading to continuous innovation and product development. Companies are increasingly focusing on sustainability and eco-friendly manufacturing processes to cater to the evolving preferences of environmentally conscious consumers. Overall, the ceramic tiles market is poised for further expansion, supported by ongoing advancements and increasing consumer adoption.

Asia-Pacific is the leading region in the Ceramic Tiles Market, fueled by rapid urbanization, robust construction activities, and increasing demand for affordable housing across emerging economies.

Global Ceramic Tiles Market Analysis 2025-2032: Industry Size, Share, Growth Trends, Competition and Forecast Report

Ceramic Tiles Market Trends

One of the prominent trends in the ceramic tiles market is the growing popularity of large-format tiles. These tiles, which often exceed standard sizes, are favored for their sleek appearance and minimal grout lines, creating a more seamless and modern look. Additionally, advancements in digital printing technologies have enabled manufacturers to produce tiles that mimic natural materials such as wood and stone with high accuracy, offering an attractive alternative to traditional materials. The rise in design versatility has expanded the applications of ceramic tiles beyond traditional settings, making them suitable for innovative uses in contemporary interior designs.

Another key trend is the increasing emphasis on eco-friendly and sustainable practices within the industry. Many manufacturers are adopting green technologies and utilizing recycled materials in tile production to minimize environmental impact. This shift aligns with the broader global movement towards sustainability and is driven by growing consumer demand for environmentally responsible products. As consumers become more conscious of their ecological footprint, the market for green ceramic tiles is expected to grow, offering opportunities for companies to differentiate themselves and appeal to a more environmentally aware clientele.

Smart home integration is also making its mark on the ceramic tiles market. Innovations such as smart tiles embedded with sensors for temperature control, lighting, or even interactive features are emerging trends. These technological advancements cater to the increasing demand for connected and intelligent home solutions. As consumers seek to enhance their living environments with smart technologies, the integration of such features into ceramic tiles presents a new frontier for market growth and differentiation, appealing to tech-savvy and luxury-oriented segments.

Ceramic Tiles Market Drivers

The growth of the ceramic tiles market is significantly driven by the booming construction industry, fueled by rising urbanization and infrastructure development. As cities expand and new residential and commercial properties are constructed, the demand for ceramic tiles increases due to their aesthetic appeal and functionality. The durability and ease of maintenance of ceramic tiles make them an ideal choice for high-traffic areas and various applications, further supporting their widespread adoption in new building projects and renovations.

Additionally, the rise in disposable incomes and changing lifestyles contribute to the market's expansion. As individuals have more financial resources, they are investing in home improvement and luxury upgrades, including high-quality ceramic tiles. The increasing focus on interior design and personalization has led to a higher demand for diverse and customizable tile options, driving growth in the market. Furthermore, the availability of a wide range of designs, colors, and finishes allows consumers to achieve their desired aesthetic, making ceramic tiles a popular choice for modern interiors.

Technological advancements in tile production also play a crucial role in driving market growth. Innovations such as digital printing and improved manufacturing processes have enhanced the quality and variety of ceramic tiles, offering consumers more options and better performance. These advancements not only enable the creation of more intricate and attractive designs but also improve the functionality of tiles, such as better resistance to stains and wear. As technology continues to evolve, the ceramic tiles market is expected to benefit from enhanced product offerings and increased consumer appeal.

Ceramic Tiles Market Challenges

Despite its growth, the ceramic tiles market faces several challenges that could impact its trajectory. One major challenge is the fluctuation in raw material prices, which can affect manufacturing costs and, consequently, product pricing. Variations in the costs of materials such as clay, silica, and other key components can lead to price instability and affect profit margins for manufacturers. Additionally, the market is highly competitive, with numerous players vying for market share. This competition can lead to price wars and increased pressure on companies to continuously innovate and improve their offerings to maintain a competitive edge. Moreover, environmental regulations and the need for sustainable practices pose challenges for manufacturers in terms of compliance and adapting production processes to meet regulatory standards. Addressing these challenges effectively will be crucial for sustaining growth and ensuring long-term success in the ceramic tiles market.

Market Players

1. Ceramiche Caesar S.p.A.
2. China Ceramics Co. Ltd.
3. Crossville Inc.
4. Florim Ceramiche S.p.A.
5. Johnson Tiles
6. Kajaria Ceramics Limited
7. Marazzi Group S.r.l.
8. Mohawk Industries
9. Porcelanosa Grupo
10. RAK Ceramics PJSC
11. Siam Cement Group
12. Somany Ceramics Limited

Market Scope

Parameter

Detail

Base Year

2024

Estimated Year

2025

Forecast Period

2026-2032

Market Size-Units

USD billion

Market Splits Covered

By Product, By Application, By End use

Countries Covered

North America (USA, Canada, Mexico)
Europe (Germany, UK, France, Spain, Italy, Rest of Europe)
Asia-Pacific (China, India, Japan, Australia, Rest of APAC)
The Middle East and Africa (Middle East, Africa)
South and Central America (Brazil, Argentina, Rest of SCA)

Analysis Covered

Latest Trends, Driving Factors, Challenges, Trade Analysis, Price Analysis, Supply-Chain Analysis, Competitive Landscape, Company Strategies

Customization

10% free customization (up to 10 analyst hours) to modify segments, geographies, and companies analyzed

Post-Sale Support

4 analyst hours, available up to 4 weeks

Delivery Format

The Latest Updated PDF and Excel Data file

Market Segmentation

By Product

  • Glazed ceramic tiles
  • Porcelain tiles
  • Scratch free ceramic tiles
  • Others

By Application

  • Wall tiles
  • Floor tiles
  • Other

By End Use

  • Residential
  • Commercial

By Geography

  • North America (USA, Canada, Mexico)
  • Europe (Germany, UK, France, Spain, Italy, Rest of Europe)
  • Asia-Pacific (China, India, Japan, Australia, Rest of APAC)
  • The Middle East and Africa (Middle East, Africa)
  • South and Central America (Brazil, Argentina, Rest of SCA)

1. Table of Contents
1.1 List of Tables
1.2 List of Figures

2. Ceramic Tiles Market Latest Trends, Drivers and Challenges, 2024- 2034
2.1 Ceramic Tiles Market Overview
2.2 Key Strategies of Leading Ceramic Tiles Companies
2.3 Ceramic Tiles Market Insights, 2024- 2034
     2.3.1 Leading Ceramic Tiles Types, 2024- 2034
     2.3.2 Leading Ceramic Tiles End-User industries, 2024- 2034
     2.3.3 Fast-Growing countries for Ceramic Tiles sales, 2024- 2034
2.4 Ceramic Tiles Market Drivers and Restraints
     2.4.1 Ceramic Tiles Demand Drivers to 2034
     2.4.2 Ceramic Tiles Challenges to 2034
2.5 Ceramic Tiles Market- Five Forces Analysis
     2.5.1 Ceramic Tiles Industry Attractiveness Index, 2024
     2.5.2 Threat of New Entrants
     2.5.3 Bargaining Power of Suppliers
     2.5.4 Bargaining Power of Buyers
     2.5.5 Intensity of Competitive Rivalry
     2.5.6 Threat of Substitutes

3. Global Ceramic Tiles Market Value, Market Share, and Forecast to 2034
3.1 Global Ceramic Tiles Market Overview, 2024
3.2 Global Ceramic Tiles Market Revenue and Forecast, 2024- 2034 (US$ Million)

3.3 Global Ceramic Tiles Market Size and Share Outlook By Product, 2024- 2034
3.3.1 Glazed ceramic tiles
3.3.2 Porcelain tiles
3.3.3 Scratch free ceramic tiles
3.3.4 Others

3.4 Global Ceramic Tiles Market Size and Share Outlook By Application, 2024- 2034
3.4.1 Wall tiles
3.4.2 Floor tiles
3.4.3 Other

3.5 Global Ceramic Tiles Market Size and Share Outlook By End Use, 2024- 2034
3.5.1 Residential
3.5.2 Commercial
3.6 Global Ceramic Tiles Market Size and Share Outlook by Region, 2024- 2034

4. Asia Pacific Ceramic Tiles Market Value, Market Share and Forecast to 2034
4.1 Asia Pacific Ceramic Tiles Market Overview, 2024
4.2 Asia Pacific Ceramic Tiles Market Revenue and Forecast, 2024- 2034 (US$ Million)
4.3 Asia Pacific Ceramic Tiles Market Size and Share Outlook By Product, 2024- 2034
4.4 Asia Pacific Ceramic Tiles Market Size and Share Outlook By Application, 2024- 2034
4.5 Asia Pacific Ceramic Tiles Market Size and Share Outlook By End Use, 2024- 2034
4.6 Asia Pacific Ceramic Tiles Market Size and Share Outlook by Country, 2024- 2034
4.7 Key Companies in Asia Pacific Ceramic Tiles Market

5. Europe Ceramic Tiles Market Value, Market Share, and Forecast to 2034
5.1 Europe Ceramic Tiles Market Overview, 2024
5.2 Europe Ceramic Tiles Market Revenue and Forecast, 2024- 2034 (US$ Million)
5.3 Europe Ceramic Tiles Market Size and Share Outlook By Product, 2024- 2034
5.4 Europe Ceramic Tiles Market Size and Share Outlook By Application, 2024- 2034
5.5 Europe Ceramic Tiles Market Size and Share Outlook By End Use, 2024- 2034
5.6 Europe Ceramic Tiles Market Size and Share Outlook by Country, 2024- 2034
5.7 Key Companies in Europe Ceramic Tiles Market

6. North America Ceramic Tiles Market Value, Market Share and Forecast to 2034
6.1 North America Ceramic Tiles Market Overview, 2024
6.2 North America Ceramic Tiles Market Revenue and Forecast, 2024- 2034 (US$ Million)
6.3 North America Ceramic Tiles Market Size and Share Outlook By Product, 2024- 2034
6.4 North America Ceramic Tiles Market Size and Share Outlook By Application, 2024- 2034
6.5 North America Ceramic Tiles Market Size and Share Outlook By End Use, 2024- 2034
6.6 North America Ceramic Tiles Market Size and Share Outlook by Country, 2024- 2034
6.7 Key Companies in North America Ceramic Tiles Market

7. South and Central America Ceramic Tiles Market Value, Market Share and Forecast to 2034
7.1 South and Central America Ceramic Tiles Market Overview, 2024
7.2 South and Central America Ceramic Tiles Market Revenue and Forecast, 2024- 2034 (US$ Million)
7.3 South and Central America Ceramic Tiles Market Size and Share Outlook By Product, 2024- 2034
7.4 South and Central America Ceramic Tiles Market Size and Share Outlook By Application, 2024- 2034
7.5 South and Central America Ceramic Tiles Market Size and Share Outlook By End Use, 2024- 2034
7.8 South and Central America Ceramic Tiles Market Size and Share Outlook by Country, 2024- 2034
7.9 Key Companies in South and Central America Ceramic Tiles Market

8. Middle East Africa Ceramic Tiles Market Value, Market Share and Forecast to 2034
8.1 Middle East Africa Ceramic Tiles Market Overview, 2024
8.2 Middle East and Africa Ceramic Tiles Market Revenue and Forecast, 2024- 2034 (US$ Million)
8.3 Middle East Africa Ceramic Tiles Market Size and Share Outlook By Product, 2024- 2034
8.4 Middle East Africa Ceramic Tiles Market Size and Share Outlook By Application, 2024- 2034
8.5 Middle East Africa Ceramic Tiles Market Size and Share Outlook By End Use, 2024- 2034
8.6 Middle East Africa Ceramic Tiles Market Size and Share Outlook by Country, 2024- 2034
8.7 Key Companies in Middle East Africa Ceramic Tiles Market

9. Ceramic Tiles Market Structure
9.1 Key Players 
9.2 Ceramic Tiles Companies - Key Strategies and Financial Analysis
     9.2.1 Snapshot
     9.2.3 Business Description
     9.2.4 Products and Services
     9.2.5 Financial Analysis

10. Ceramic Tiles Industry Recent Developments

11 Appendix
11.1 Publisher Expertise
11.2 Research Methodology
11.3 Annual Subscription Plans
11.4 Contact Information


Get Free Sample

At OG Analysis, we understand the importance of informed decision-making in today's dynamic business landscape. To help you experience the depth and quality of our market research reports, we offer complimentary samples tailored to your specific needs.

Start Now! Please fill the form below for your free sample.

Why Request a Free Sample?

Evaluate Our Expertise: Our reports are crafted by industry experts and seasoned analysts. Requesting a sample allows you to assess the depth of research and the caliber of insights we provide.

Tailored to Your Needs: Let us know your industry, market segment, or specific topic of interest. Our free samples are customized to ensure relevance to your business objectives.

Witness Actionable Insights: See firsthand how our reports go beyond data, offering actionable insights and strategic recommendations that can drive your business forward.

Embark on your journey towards strategic decision-making by requesting a free sample from OG Analysis. Experience the caliber of insights that can transform the way you approach your business challenges.

You can purchase individual sections of this report. Explore pricing options for specific sections.

FAQ's

The Ceramic Tiles Market is estimated to reach USD 243.2 billion by 2032.

The Global Ceramic Tiles Market is expected to grow at a Compound Annual Growth Rate (CAGR) of 2.8% during the forecast period from 2025 to 2032.

The Global Ceramic Tiles Market is estimated to generate USD 195 billion in revenue in 2024.

License

Didn’t find what you’re looking for? TALK TO OUR ANALYST TEAM

Need something within your budget? NO WORRIES! WE GOT YOU COVERED!

Related Products

Oxygen Reduction System Market Analysis and Outlook Report: Industry Size, Share, Growth Trends, and Forecast (2025-2034)

The Oxygen Reduction System Market is emerging as a sophisticated fire prevention solution designed to mitigate the risk of combustion in critical infrastructure environments. By lowering the oxygen concentration in a protected space to levels below the ignition threshold for most materials, these systems create an atmosphere in which fires cannot ignite or spread. Unlike traditional suppression systems that activate after a fire has begun, oxygen reduction systems are preventative, offering continuous protection without water or chemical agents. These systems are particularly favored in data centers, cold storage facilities, museums, archives, and automated warehouses—places where traditional suppression methods could damage sensitive assets. The increasing need for uninterrupted operation, high-value asset protection, and regulatory compliance is driving wider adoption across sectors that prioritize loss prevention and risk management. In 2024, the oxygen reduction system market is seeing rapid technological innovation focused on energy efficiency, continuous monitoring, and integration with smart building infrastructure. Companies are developing modular systems that are easier to retrofit in existing buildings, enabling broader accessibility beyond new construction projects. Integration with building management systems (BMS), remote diagnostics, and IoT-enabled sensors are enabling real-time data analysis and predictive maintenance, enhancing system reliability. Europe continues to dominate market adoption due to strict fire safety standards and insurance incentives, while North America and Asia-Pacific are seeing growing uptake in logistics hubs, defense facilities, and pharmaceutical warehouses. Market players are investing in awareness campaigns to educate facility managers and insurance providers on the long-term cost savings and reduced risk profiles enabled by oxygen reduction technology. As demand for smart, proactive fire protection systems grows, oxygen reduction is positioning itself as a sustainable and scalable solution for the future of fire safety. Key Takeaways – Oxygen Reduction System Market Oxygen reduction systems provide continuous fire prevention by maintaining oxygen levels below combustion thresholds, offering a proactive alternative to traditional fire suppression systems. These systems are particularly well-suited for high-value, mission-critical environments such as data centers, museums, pharmaceutical storage, and logistics hubs. Modular and retrofittable designs are trending, enabling easier integration into both new construction and existing facilities. Smart building integration with BMS and IoT-enabled components is enhancing remote monitoring, diagnostics, and system control. Energy-efficient nitrogen generators and low-maintenance compressors are being developed to reduce operational costs and environmental impact. One major driver is the demand for continuous, non-disruptive fire prevention in sectors where downtime or asset loss would be costly or catastrophic. Europe remains the largest market due to early adoption, stringent regulations, and strong insurance incentives for fire protection innovation. North America and Asia-Pacific are catching up quickly, driven by growing awareness and increased investments in resilient infrastructure. Lack of awareness and higher upfront costs remain challenges for broader adoption, particularly in developing economies and small enterprises. Market fragmentation is evident, with regional system integrators competing alongside global building technology firms for share in specialized segments. Vendors are expanding service portfolios to include system design, compliance support, and lifecycle maintenance contracts. Insurance companies are starting to recognize oxygen reduction systems as risk-reducing technologies, offering better premiums for protected facilities. Customized solutions are gaining ground in warehouses with varying heights and zoning requirements, enabling tailored oxygen level control. Regulatory updates in fire protection codes are beginning to include oxygen reduction as an accepted and recommended methodology. Strategic partnerships between technology providers and fire safety consultants are helping accelerate system adoption across new verticals. Parameter Detail Base Year 2024 Estimated Year 2025 Forecast Period 2026-2032 Market Size-Units USD billion Market Splits Covered By Product Type, By Application, By End User, By Technology, By Distribution Channel Countries Covered North America (USA, Canada, Mexico) Europe (Germany, UK, France, Spain, Italy, Rest of Europe) Asia-Pacific (China, India, Japan, Australia, Rest of APAC) The Middle East and Africa (Middle East, Africa) South and Central America (Brazil, Argentina, Rest of SCA) Analysis Covered Latest Trends, Driving Factors, Challenges, Trade Analysis, Price Analysis, Supply-Chain Analysis, Competitive Landscape, Company Strategies Customization 10% free customization (up to 10 analyst hours) to modify segments, geographies, and companies analyzed Post-Sale Support 4 analyst hours, available up to 4 weeks Delivery Format The Latest Updated PDF and Excel Datafile

Published:May-2025

Self-adhesive Labeler Machine Market Analysis and Outlook Report: Industry Size, Share, Growth Trends, and Forecast (2025-2034)

The self-adhesive labeler machine market has experienced steady growth as companies across various industries strive to enhance branding, compliance, and operational efficiency. Self-adhesive labeler machines streamline the process of applying pressure-sensitive labels to products and packaging, offering consistent placement, speed, and flexibility. They are widely used in industries such as food and beverage, pharmaceuticals, personal care, and logistics, where reliable labeling is essential for consumer confidence, regulatory compliance, and supply chain management. Unlike traditional label applicators, these machines eliminate the need for heat, water, or adhesives during application, making them cleaner, faster, and more efficient. As businesses continue to adopt self-adhesive labelers to improve production throughput and ensure consistent quality, the market has expanded steadily, supported by advancements in automation and smart technology integration. Recent innovations in self-adhesive labeling machines include the incorporation of touchless sensors, user-friendly interfaces, and IoT connectivity, which have further enhanced productivity and operational transparency. These systems can handle a wide range of label sizes, shapes, and materials, making them adaptable to diverse packaging requirements. However, high initial costs, maintenance demands, and the need for specialized operators remain significant challenges for smaller manufacturers and emerging markets. Leading companies are responding by offering modular systems, flexible pricing options, and comprehensive support services. They are also investing in research and development to create more energy-efficient, sustainable, and compact labelers. With growing consumer demand for transparent, traceable, and eco-friendly packaging, the self-adhesive labeler machine market is poised for continued growth, driven by innovation, increasing automation adoption, and a strong focus on sustainability. Asia Pacific is the leading region in the self-adhesive labeler machine market, propelled by rapid industrial automation, expanding packaging sectors in countries like China and India, and rising demand for high-speed labeling solutions across food, beverage, and pharmaceutical industries. Fully automatic labeler machines dominate the segment, fueled by the need for enhanced operational efficiency, reduced labor dependency, and increasing adoption in high-volume production environments. Self-Adhesive Labeler Machine Market - Key Takeaways Self-adhesive labeler machines streamline the application of pressure-sensitive labels. They are widely used in industries such as food and beverage, pharmaceuticals, personal care, and logistics. These machines enhance branding, regulatory compliance, and supply chain efficiency. Unlike traditional methods, self-adhesive labelers do not require heat, water, or adhesive during application. Advanced models feature touchless sensors, user-friendly interfaces, and IoT connectivity. They can handle a wide variety of label sizes, shapes, and materials, increasing versatility. High initial costs and maintenance demands remain challenges for smaller businesses. Leading players offer modular systems, flexible pricing, and extensive support services. Investments in energy-efficient and sustainable labelers are gaining traction. Transparent, traceable, and eco-friendly packaging trends are driving market demand. Asia-Pacific and Latin America are emerging as key growth regions due to increasing industrialization and consumer goods production. North America and Europe dominate the market due to advanced manufacturing infrastructure and strict regulations. Continuous R&D efforts are producing more compact, efficient, and reliable machines. Customizable solutions for specific packaging requirements boost adoption in specialized markets. With rising automation and sustainability priorities, the self-adhesive labeler machine market is well-positioned for steady expansion. Market Scope Parameter Detail Base Year 2024 Estimated Year 2025 Forecast Period 2026-2032 Market Size-Units USD billion Market Splits Covered By Product Type, By Application, By End User, By Technology, By Distribution Channel Countries Covered North America (USA, Canada, Mexico) Europe (Germany, UK, France, Spain, Italy, Rest of Europe) Asia-Pacific (China, India, Japan, Australia, Rest of APAC) The Middle East and Africa (Middle East, Africa) South and Central America (Brazil, Argentina, Rest of SCA) Analysis Covered Latest Trends, Driving Factors, Challenges, Trade Analysis, Price Analysis, Supply-Chain Analysis, Competitive Landscape, Company Strategies Customization 10% free customization (up to 10 analyst hours) to modify segments, geographies, and companies analyzed Post-Sale Support 4 analyst hours, available up to 4 weeks Delivery Format The Latest Updated PDF and Excel Data file

Published:May-2025

Automatic Blasting Machine Market Analysis and Outlook Report: Industry Size, Share, Growth Trends, and Forecast (2025-2034)

The Automatic Blasting Machine Market is steadily growing as industries increasingly prioritize efficiency, surface precision, and safety in metal preparation and finishing processes. Automatic blasting machines are designed to clean, roughen, or polish surfaces by propelling abrasive materials at high velocity, and are widely used in automotive, aerospace, shipbuilding, foundry, construction, and general manufacturing sectors. These machines enhance production throughput, reduce labor dependency, and ensure consistent surface treatment across complex geometries. With capabilities like programmable shot patterns, integrated dust collection, and robotic arms, automatic systems have become indispensable in applications requiring high-quality finishes and repeatable outcomes. The shift from manual to automated surface preparation solutions is being accelerated by demand for tighter quality control and reduced production lead times. In 2024, key market drivers include rising demand for energy-efficient systems, advancements in automation technology, and growth in industries reliant on protective and aesthetic coatings. Europe and North America lead in the adoption of automated blasting due to mature industrial sectors and strong occupational safety regulations. Meanwhile, Asia-Pacific is witnessing rapid growth, particularly in China and India, driven by infrastructure expansion and booming automotive production. Manufacturers are investing in smart machine technologies, remote monitoring capabilities, and eco-friendly blasting media to meet evolving environmental and operational standards. However, challenges such as high initial setup costs, limited skilled labor, and maintenance complexity continue to hinder smaller-scale adoption. As surface engineering becomes more integral to product durability and visual appeal, the automatic blasting machine market is poised to remain a crucial part of modern manufacturing ecosystems. Key Takeaways – Automatic Blasting Machine Market Automatic blasting machines provide efficient and consistent surface cleaning, preparation, and finishing for industrial components. Applications span across automotive, aerospace, shipbuilding, metal fabrication, and construction materials industries. Europe and North America dominate in terms of technological adoption, regulatory compliance, and focus on operator safety. Asia-Pacific is a fast-growing market driven by industrialization, infrastructure projects, and localized manufacturing expansion. Automation reduces labor dependency and increases productivity, especially in high-volume production environments. Advanced machines feature programmable controls, robotic arms, and integration with Industry 4.0 systems for real-time monitoring. Eco-friendly and recyclable blasting media, such as steel grit and glass beads, are becoming more popular to meet sustainability goals. High energy consumption and dust control requirements pose challenges in plant integration and environmental compliance. Machine customization based on part size, material, and throughput requirements is a key differentiator among manufacturers. High initial capital investment and the need for regular maintenance remain barriers for small and mid-sized enterprises. Digital interfaces and IoT-based diagnostics are improving operational transparency and preventive maintenance capabilities. Modular designs and portable blasting machines are being developed for job site flexibility and niche applications. Training and support services are becoming crucial to ensure safe and effective machine operation across varied user bases. Blasting automation is increasingly linked to downstream processes like coating, welding, and machining for seamless workflow. Strategic partnerships between machine builders and OEMs are fostering co-engineered solutions for advanced manufacturing needs. Parameter Detail Base Year 2024 Estimated Year 2025 Forecast Period 2026-2032 Market Size-Units USD billion Market Splits Covered By Product Type, By Application, By End User, By Technology, By Distribution Channel Countries Covered North America (USA, Canada, Mexico) Europe (Germany, UK, France, Spain, Italy, Rest of Europe) Asia-Pacific (China, India, Japan, Australia, Rest of APAC) The Middle East and Africa (Middle East, Africa) South and Central America (Brazil, Argentina, Rest of SCA) Analysis Covered Latest Trends, Driving Factors, Challenges, Trade Analysis, Price Analysis, Supply-Chain Analysis, Competitive Landscape, Company Strategies Customization 10% free customization (up to 10 analyst hours) to modify segments, geographies, and companies analyzed Post-Sale Support 4 analyst hours, available up to 4 weeks Delivery Format The Latest Updated PDF and Excel Datafile

Published:May-2025