Nanodiamonds Market Outlook report

Published On: Feb, 2025
|
Pages: 140+

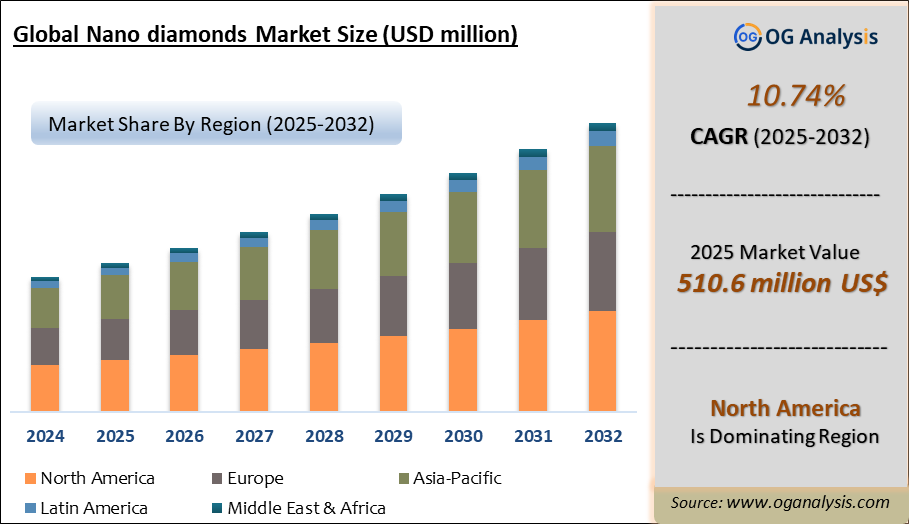
The Nanodiamonds Market is estimated to be USD 416.1 million in 2024. Furthermore, the market is expected to grow to USD 849.8 million by 2031, with a Compound Annual Growth Rate (CAGR) of 10.74%.

The nanodiamonds market is witnessing robust growth driven by their unique mechanical, optical, and chemical properties, which enable diverse applications across industries. Nanodiamonds are carbon-based nanoparticles with diameters below 10 nm, produced mainly through detonation, high-pressure high-temperature synthesis, and chemical vapor deposition techniques. Their excellent hardness, thermal conductivity, biocompatibility, and ability to disperse in various matrices make them suitable for use in polishing, lubricants, drug delivery systems, bioimaging, quantum computing, and composite reinforcement. The growing demand for advanced polishing agents in the semiconductor and optics industries, coupled with rising adoption in medical and pharmaceutical research for targeted drug delivery and diagnostics, is accelerating market expansion globally.

Regionally, Asia Pacific dominates the nanodiamonds market due to large-scale manufacturing facilities, high adoption in electronics and precision polishing sectors, and emerging biomedical research investments in China, Japan, and South Korea. North America and Europe follow, driven by advanced research in quantum sensing, nanomedicine, and aerospace materials. However, challenges such as high production costs, scalability limitations for consistent purity and particle size, and environmental concerns regarding detonation synthesis remain key restraints. Leading companies and research institutions are focusing on optimizing cost-effective, sustainable production technologies and developing surface-functionalized nanodiamonds to enhance application compatibility. Strategic partnerships, patent developments, and commercial pilot programs for quantum and medical-grade nanodiamonds are expected to define market competitiveness, positioning nanodiamonds as critical materials in next-generation electronics, photonics, medical, and energy storage technologies worldwide.

Industrial grade is the largest segment by type in the nanodiamonds market. This is due to their extensive use in polishing, electroplating, coatings, and composite reinforcement applications, where their hardness, thermal conductivity, and cost-effectiveness provide performance benefits for semiconductor, optics, and manufacturing industries compared to medical-grade nanodiamonds.

Polishing is the largest application segment in the nanodiamonds market. Its dominance is driven by widespread use in precision polishing of semiconductors, optical lenses, and metal surfaces, where nanodiamonds deliver uniform surface finishing, minimal material removal rates, and superior product quality, supporting their high-volume adoption globally.

Global Nano diamonds Market Analysis 2025-2032: Industry Size, Share, Growth Trends, Competition and Forecast Report

Key Insights

  • The nanodiamonds market is driven by growing demand in the polishing industry, where their ultra-hardness and uniform nanoscale size enable superior surface finishing for semiconductors, optics, and precision instruments, ensuring high-quality outputs with minimal abrasion damage.
  • Biomedical applications are expanding, as nanodiamonds are increasingly used for targeted drug delivery, gene therapy, and bioimaging. Their excellent biocompatibility and ability to attach therapeutic agents enable efficient and safe delivery systems for cancer treatments and advanced diagnostics.
  • Asia Pacific leads the market due to strong manufacturing infrastructure in China, Japan, and South Korea, high adoption in electronics polishing, and growing investments in biomedical nanotechnology research across regional academic and industrial ecosystems.
  • North America and Europe are witnessing steady growth driven by quantum computing and quantum sensing research, leveraging nitrogen-vacancy nanodiamonds for applications in secure communications, quantum memory, and nanoscale magnetic field detection technologies.
  • Detonation synthesis remains the most widely used nanodiamond production technique due to its scalability and cost-effectiveness; however, it presents environmental concerns and requires advanced purification processes to achieve application-grade purity levels.
  • Surface functionalization is gaining traction, enhancing nanodiamond dispersion in polymers, resins, and biological systems. This improves compatibility for composite materials, coatings, and drug delivery carriers, expanding market applications across diverse industries.
  • Nanodiamond-based lubricants are emerging, reducing friction and wear in automotive engines and industrial machinery. Their nano-scale polishing effect enhances component durability, fuel efficiency, and operational performance in demanding mechanical environments.
  • High production costs and challenges in ensuring consistent particle size and purity continue to limit widespread market adoption. Companies are investing in process optimization, advanced purification methods, and alternative synthesis routes to address these barriers effectively.
  • Strategic collaborations between nanodiamond producers, research institutions, and end-user industries are increasing to accelerate the development of application-specific products, performance validation, and commercial deployment in high-value sectors.
  • The competitive landscape is characterized by patent-driven differentiation, with companies focusing on developing quantum-grade and medical-grade nanodiamonds to secure leadership positions in emerging markets such as quantum computing, advanced bioimaging, and targeted therapeutics.

Reort Scope

Parameter Detail
Base Year 2024
Estimated Year 2025
Forecast Period 2026-2034
Market Size-Units USD billion
Market Splits Covered By Type, By Application
Countries Covered North America (USA, Canada, Mexico)
Europe (Germany, UK, France, Spain, Italy, Rest of Europe)
Asia-Pacific (China, India, Japan, Australia, Rest of APAC)
The Middle East and Africa (Middle East, Africa)
South and Central America (Brazil, Argentina, Rest of SCA)
Analysis Covered Latest Trends, Driving Factors, Challenges, Supply-Chain Analysis, Competitive Landscape, Company Strategies
Customization 10 % free customization (up to 10 analyst hours) to modify segments, geographies, and companies analyzed
Post-Sale Support 4 analyst hours, available up to 4 weeks
Delivery Format The Latest Updated PDF and Excel Datafile

Market Segmentation

 By Type

  • Medical Grade
  • Industrial Grade

 By Application

  • Polishing
  • Electroplating and Coatings
  • Composites
  • Lubricants
  • Medical Diagnosis
  • Other

 By Geography

  • North America (USA, Canada, Mexico)
  • Europe (Germany, UK, France, Spain, Italy, Russia, Rest of Europe)
  • Asia-Pacific (China, India, Japan, Australia, South Korea, Indonesia, Malaysia, Vietnam, Rest of APAC)
  • The Middle East and Africa (Saudi Arabia, South Africa, UAE, Iran, Egypt, Rest of MEA)
  • South and Central America (Brazil, Argentina, Chile, Rest of SCA)

Nanodiamonds Market

  • CARBODEON LTD. OY

  • Kerridge Commercial Systems Limited

  • Ray Techniques Ltd

  • Daicel Corporation

  • SINO-CRYSTAL MICRO-DIAMOND

  • FND BIOTECH

  • Adámas Nanotechnologies

  • SINTA

  • TONG LI TECH CO LTD.

  • Columbus NanoWorks In


What You Receive

• Global Nanodiamonds market size and growth projections (CAGR), 2024- 2034
• Impact of recent changes in geopolitical, economic, and trade policies on the demand and supply chain of Nanodiamonds.
• Nanodiamonds market size, share, and outlook across 5 regions and 27 countries, 2025- 2034.
• Nanodiamonds market size, CAGR, and Market Share of key products, applications, and end-user verticals, 2025- 2034.
• Short and long-term Nanodiamonds market trends, drivers, restraints, and opportunities.
• Porter’s Five Forces analysis, Technological developments in the Nanodiamonds market, Nanodiamonds supply chain analysis.
• Nanodiamonds trade analysis, Nanodiamonds market price analysis, Nanodiamonds Value Chain Analysis.
• Profiles of 5 leading companies in the industry- overview, key strategies, financials, and products.
• Latest Nanodiamonds market news and developments.
The Nanodiamonds Market international scenario is well established in the report with separate chapters on North America Nanodiamonds Market, Europe Nanodiamonds Market, Asia-Pacific Nanodiamonds Market, Middle East and Africa Nanodiamonds Market, and South and Central America Nanodiamonds Markets. These sections further fragment the regional Nanodiamonds market by type, application, end-user, and country.

Who can benefit from this research

The research would help top management/strategy formulators/business/product development/sales managers and investors in this market in the following ways
1. The report provides 2024 Nanodiamonds market sales data at the global, regional, and key country levels with a detailed outlook to 2034, allowing companies to calculate their market share and analyze prospects, uncover new markets, and plan market entry strategy.
2. The research includes the Nanodiamonds market split into different types and applications. This segmentation helps managers plan their products and budgets based on the future growth rates of each segment
3. The Nanodiamonds market study helps stakeholders understand the breadth and stance of the market giving them information on key drivers, restraints, challenges, and growth opportunities of the market and mitigating risks
4. This report would help top management understand competition better with a detailed SWOT analysis and key strategies of their competitors, and plan their position in the business
5. The study assists investors in analyzing Nanodiamonds business prospects by region, key countries, and top companies' information to channel their investments.
 

Available Customizations

The standard syndicate report is designed to serve the common interests of Nanodiamonds Market players across the value chain and include selective data and analysis from entire research findings as per the scope and price of the publication.
However, to precisely match the specific research requirements of individual clients, we offer several customization options to include the data and analysis of interest in the final deliverable.

Some of the customization requests are as mentioned below :
Segmentation of choice – Our clients can seek customization to modify/add a market division for types/applications/end-uses/processes of their choice.
Nanodiamonds Pricing and Margins Across the Supply Chain, Nanodiamonds Price Analysis / International Trade Data / Import-Export Analysis
Supply Chain Analysis, Supply–Demand Gap Analysis, PESTLE Analysis, Macro-Economic Analysis, and other Nanodiamonds market analytics
Processing and manufacturing requirements, Patent Analysis, Technology Trends, and Product Innovations
Further, the client can seek customization to break down geographies as per their requirements for specific countries/country groups such as South East Asia, Central Asia, Emerging and Developing Asia, Western Europe, Eastern Europe, Benelux, Emerging and Developing Europe, Nordic countries, North Africa, Sub-Saharan Africa, Caribbean, The Middle East and North Africa (MENA), Gulf Cooperation Council (GCC) or any other.
Capital Requirements, Income Projections, Profit Forecasts, and other parameters to prepare a detailed project report to present to Banks/Investment Agencies.
Customization of up to 10% of the content can be done without any additional charges.
Note: Latest developments will be updated in the report and delivered within 2 to 3 working days.

TABLE OF CONTENTS

1. TABLE OF CONTENTS
1.1. LIST of TABLES
1.2. LIST of FIGURES

2. GLOBAL NANODIAMONDS MARKET REVIEW, 2023
2.1. Nanodiamonds Market Industry Overview
2.2. Research Methodology
2.2.1. Market Scope and Definition
2.2.2. Study Assumptions

3. NANODIAMONDS MARKET INSIGHTS
3.1. Key Types of Nanodiamonds Market to 2031
3.2. Leading Metal of Nanodiamonds Market to 2031
3.3. High Prospect Geography for Nanodiamonds Market to 2031

4. NANODIAMONDS MARKET TRENDS, DRIVERS, AND RESTRAINTS
4.1. Latest Trends and Recent Developments in Nanodiamonds Market
4.1.1. Technological Advancements
4.1.2. Recent Developments of Nanodiamonds In Coating Applications
4.1.3. Rising Demand from Emerging Economies
4.2. Key Factors Driving the Nanodiamonds Market Growth
4.2.1. Expanding Application Scope of Nanodiamonds
4.2.2. Rising Demand for Nanodiamonds Applications in Automotive Industry
4.3. Major Challenges to the Nanodiamonds Market Industry, 2023-2031
4.4. Five Forces Analysis for Global Nanodiamonds Market

5. GLOBAL NANODIAMONDS MARKET DATA - INDUSTRY SIZE, SHARE, AND OUTLOOK
5.1. Nanodiamonds Market Annual Sales Outlook, 2023-2031 ($Million)
5.2. Global Nanodiamonds Market Annual Sales Outlook by Type, 2023-2031 ($Million)
5.2.1. Medical Grade Nanodiamond Market Outlook, 2023-2031
5.2.2. Industrial Grade Market Outlook, 2023-2031
5.3. Global Nanodiamonds Market Annual Sales Outlook by Application, 2023-2031 ($Million)
5.3.1. Polishing Market Outlook, 2023-2031
5.3.2. Electroplating and Coatings Market Outlook, 2023-2031
5.3.3. Composites Market Outlook, 2023-2031
5.3.4. Lubricants Market Outlook, 2023-2031
5.3.5. Medical Diagnosis Market Outlook, 2023-2031
5.3.6. Other Market Outlook, 2023-2031
5.4. Global Nanodiamonds Market Annual Sales Outlook by Geography, 2023-2031 ($Million)

6. ASIA PACIFIC NANODIAMONDS MARKET INDUSTRY STATISTICS - MARKET SIZE, SHARE, COMPETITION AND OUTLOOK
6.1. Asia Pacific Market Insights, 2023
6.2. Asia Pacific Nanodiamonds Market Revenue Forecast by Type, 2023-2031 (USD Million)
6.3. Asia Pacific Nanodiamonds Market Revenue Forecast by Application, 2023-2031 (USD Million)
6.4. Asia Pacific Nanodiamonds Market Revenue Forecast by Country, 2023-2031 (USD Million)
6.4.1. China
6.4.2. Japan
6.4.3. India
6.4.4. Rest of Asia Pacific

7. EUROPE OUTLOOK AND GROWTH OPPORTUNITIES
7.1. Europe Market Insights, 2023
7.2. Europe Nanodiamonds Market Revenue Forecast by Type, 2023-2031 (USD Million)
7.3. Europe Nanodiamonds Market Revenue Forecast by Application, 2023-2031 (USD Million)
7.4. Europe Nanodiamonds Market Revenue Forecast by Country, 2023-2031 (USD Million)
7.4.1. Germany
7.4.2. United Kingdom
7.4.3. France
7.4.4. Italy
7.4.5. Spain
7.4.6. Rest of Europe

8. NORTH AMERICA OUTLOOK AND GROWTH OPPORTUNITIES
8.1. North America Market Insights, 2023
8.2. North America Nanodiamonds Market Revenue Forecast by Type, 2023-2031 (USD Million)
8.3. North America Nanodiamonds Market Revenue Forecast by Application, 2023-2031 (USD Million)
8.4. North America Nanodiamonds Market Revenue Forecast by Country, 2023-2031 (USD Million)
8.4.1. United States
8.4.2. Canada
8.4.3. Mexico

9. SOUTH AND CENTRAL AMERICA OUTLOOK AND GROWTH OPPORTUNITIES
9.1. South and Central America Market Insights, 2023
9.2. South and Central America Nanodiamonds Market Revenue Forecast by Type, 2023-2031 (USD Million)
9.3. South and Central America Nanodiamonds Market Revenue Forecast by Application, 2023-2031 (USD Million)
9.4. South and Central America Nanodiamonds Market Revenue Forecast by Country, 2023-2031 (USD Million)
9.4.1. Brazil
9.4.2. Argentina
9.4.3. Rest of South and Central America

10. MIDDLE EAST AFRICA OUTLOOK AND GROWTH OPPORTUNITIES
10.1. Middle East Africa Market Insights, 2023
10.2. Middle East Africa Nanodiamonds Market Revenue Forecast by Type, 2023-2031 (USD Million)
10.3. Middle East Africa Nanodiamonds Market Revenue Forecast by Application, 2023-2031 (USD Million)
10.4. Middle East Africa Nanodiamonds Market Revenue Forecast by Country, 2023-2031 (USD Million)
10.4.1. Middle East
10.4.2. Africa

11. NANODIAMONDS MARKET STRUCTURE AND COMPETITIVE LANDSCAPE
11.1. ADAMAS NANOTECHNOLOGIES, INC.
11.2. CYMARIS LABS
11.3. FND BIOTECH, INC.
11.4. DAICEL CORPORATION
11.5. PLASMACHEM GMBH

12. APPENDIX
12.1. Nanodiamonds Relevant Trade
12.2. About Us
12.3. Sources
12.4. Research Methodology
12.5. Research Process
12.6. Research Execution
12.7. Contact Information


Get Free Sample

At OG Analysis, we understand the importance of informed decision-making in today's dynamic business landscape. To help you experience the depth and quality of our market research reports, we offer complimentary samples tailored to your specific needs.

Start Now! Please fill the form below for your free sample.

Why Request a Free Sample?

Evaluate Our Expertise: Our reports are crafted by industry experts and seasoned analysts. Requesting a sample allows you to assess the depth of research and the caliber of insights we provide.

Tailored to Your Needs: Let us know your industry, market segment, or specific topic of interest. Our free samples are customized to ensure relevance to your business objectives.

Witness Actionable Insights: See firsthand how our reports go beyond data, offering actionable insights and strategic recommendations that can drive your business forward.

Embark on your journey towards strategic decision-making by requesting a free sample from OG Analysis. Experience the caliber of insights that can transform the way you approach your business challenges.

You can purchase individual sections of this report. Explore pricing options for specific sections.

FAQ's

The Global Nanodiamonds Market is estimated to generate USD 416.1 million in revenue in 2024.

The Global Nanodiamonds Market is expected to grow at a Compound Annual Growth Rate (CAGR) of 10.74% during the forecast period from 2025 to 2032.

The Nanodiamonds Market is estimated to reach USD 941.1 million by 2032.

License

$4150- 5%

$6450- 10%

$8450- 15%

Didn’t find what you’re looking for? TALK TO OUR ANALYST TEAM

Need something within your budget? NO WORRIES! WE GOT YOU COVERED!

Related Products

Ground Calcium Carbonate Market Outlook Report

Ground Calcium Carbonate Market Overview Ground calcium carbonate commonly referred to as GCC is finely ground limestone or marble, a calcium carbonate material having the chemical formula, CaCO3. GCC accounts for more than 80% of the Calcium carbonate market that is available in Ground Calcium Carbonate (GCC) and Precipitated Calcium Carbonate (PCC) forms. GCC is produced by mechanical grinding of the raw material, limestone, and then classified to the desired size without involving any chemical change in the process. In a magnified view, the distribution of particle sizes in a GCC is much broader than for a PCC of the same size, implying that there are many more large particles and many more small particles than in a PCC. The size of the largest of the particles (the ""top size"") is much greater for a GCC than for a PCC, thus making GCC a less refined version of Calcium carbonate. GCC is widely used as an industrial mineral is differentiated by three primary attributes - particle size, color and chemical purity. The mineral finds application in various industries based on its quality and suitability of use. Latest Trends in Ground Calcium Carbonate Market Growing Usage of Calcium Carbonate as Industrial Filler: Industrial filler has been the top and continuously growing application for calcium carbonate. Finely ground calcium carbonate is used as a filler in plastics, paints, and paper to improve aesthetics, and functionality and to save on filling costs. Calcium carbonate consumption as the filler has the potential to exceed calcium carbonate used as a dimension stone, in a few key markets. The most abundant sources of carbonate mineral fillers are the reserves of white marble. The most important attributes of carbonate fillers that decide their usefulness in industrial applications are particle size, brightness (whiteness), and chemical purity. Fillers were earlier used to substitute costlier materials in paint or polymers in rubbers or plastics. Currently, they are being used to add stiffness, color, opacity, or other required qualities to a product. Innovative technologies allowing the usage of GCC in new applications without altering the originality and functionality are aiding further penetration of GCC. Driving Factors Increase in Demand from the Construction and Infrastructure Sector: Robust development in construction and infrastructure activities across the world is generating demand for paints, coatings, adhesives, ceramics and various other polymers and concretes. These end-users are further deriving demand for ground calcium carbonate materials. Increasing Population, growing urbanization and fast-developing economies, especially in Asia and the Middle East, have led to growth in the need for infrastructure. Huge developments in infra projects and high-rise apartments necessitate lightweight and cost-effective options. Ground Calcium Carbonate is evolving robustly to match those requirements precisely. Market Challenges Environmental hazards of limestone mining: Limestone mining can disturb groundwater conditions. Limestone deposits frequently arise in association with karst, a landscape where limestone gradually dissolves underground. The deposits result in caves, sinkholes, and areas of rock ruptures that create underground drainage areas. Mining in karst can disturb natural aquifers and alter the flow of the underground water. Excavating operations often remove ground water to expose the mining site; this can decrease the level of the water table and alter water flows through rock formations. Streams and rivers can be changed when mines pump excess water from a limestone quarry into natural downstream channels. This increases the danger of flooding and any pollutants or alterations in water quality disturb the surface water. Companies Mentioned J.M. Huber Corporation Mississippi Lime Company Imerys Omya AG Minerals Technologies Inc. Mississippi Lime Company Carmeuse Shiraishi Kogyo Kaisha, Ltd. Maruo Calcium Co. Ltd. Okutama Kogyo Co., Ltd. Newpark Resources, Inc. *The companies above are listed in no particular order. Report Scope Details Market Value- $ Million,2024 22,357 Market Growth (Value), (2024-2031)- % 5.83 Leading Region Xx Base Year 2023 Forecast Period 2024 to 2031 Segments Covered By Form, By End Use Geography Covered North America, Europe, Asia-Pacific, South and Central America, and Middle East & Africa

Published:Feb-2025

Home Care Packaging Market Analysis and Outlook Report: Industry Size, Share, Growth Trends, and Forecast (2025-2034)

The Home Care Packaging market is a key segment of the global packaging industry, addressing the diverse needs of household cleaning and maintenance products such as laundry detergents, surface cleaners, dishwashing liquids, air fresheners, and disinfectants. Packaging in this sector is designed to ensure product safety, convenience, durability, and appeal while meeting regulatory standards for chemical handling. The market is driven by rising urbanization, lifestyle changes, and increasing consumer awareness about hygiene, which has heightened demand for efficient and safe packaging solutions. Flexible pouches, bottles, aerosols, trigger sprays, and refill packs are among the most commonly used formats. Brand owners and manufacturers are also leveraging packaging as a marketing tool, with innovative designs, attractive labeling, and user-friendly dispensing systems influencing consumer choices. With home care products being used daily, the role of packaging extends beyond protection to enabling convenience, functionality, and sustainability in household management. The market outlook emphasizes the growing shift toward sustainable packaging solutions, with companies adopting recyclable, biodegradable, and reusable materials to align with environmental goals and reduce plastic waste. Innovations such as concentrated refills, lightweight containers, and bulk packaging are gaining popularity, particularly as consumers demand eco-friendly alternatives without compromising product quality. Digital printing and smart labeling are enhancing product differentiation and transparency, offering features such as usage instructions, QR codes, and tamper evidence. Asia-Pacific dominates the market due to high population density and growing urban consumer bases, while North America and Europe lead in sustainable and regulatory-driven innovations. Latest trends also include refill stations in retail, e-commerce-ready packaging formats, and anti-bacterial coatings for added safety. Despite challenges such as volatile raw material prices and compliance with sustainability regulations, the home care packaging market is poised for strong growth as consumer expectations, technology, and sustainability initiatives converge to redefine product presentation and performance.Report Scope Parameter Detail Base Year 2024 Estimated Year 2025 Forecast Period 2026-2034 Market Size-Units USD billion/Million Market Splits Covered By Packaging Type ,By Material ,By Product Countries Covered North America (USA, Canada, Mexico) Europe (Germany, UK, France, Spain, Italy, Rest of Europe) Asia-Pacific (China, India, Japan, Australia, Rest of APAC) The Middle East and Africa (Middle East, Africa) South and Central America (Brazil, Argentina, Rest of SCA) Analysis Covered Latest Trends, Driving Factors, Challenges, Supply-Chain Analysis, Competitive Landscape, Company Strategies Customization 10% free customization(up to 10 analyst hours) to modify segments, geographies, and companies analyzed Post-Sale Support 4 analyst hours, available up to 4 weeks Delivery Format The Latest Updated PDF and Excel Datafile Regional Insights North America Home Care Packaging Market The North America home care packaging market is shaped by premiumization, retailer sustainability scorecards, and e-commerce logistics that demand robust, leak-proof formats. Market dynamics reward lightweighting, PCR incorporation, and child-resistant/tamper-evident closures across detergents, surface cleaners, disinfectants, and air care. Lucrative opportunities exist in concentrated refills, reusable dispensers, mono-material pouches, and curbside-recyclable trigger systems designed for high-viscosity formulations. Latest trends include digital printing for small-batch personalization, QR-enabled usage and safety guidance, and e-commerce ready-pack designs that reduce damage rates and returns. The forecast points to steady growth as brands expand refill ecosystems in mass retail and direct-to-consumer channels. Recent developments focus on advanced barrier coatings that maintain product integrity without compromising recyclability, closed-loop PCR supply agreements, and modular dispensing platforms that standardize components across multiple SKUs. Asia Pacific Home Care Packaging Market Asia Pacific leads in volume, driven by urbanization, rising hygiene awareness, and rapid growth of online marketplaces and quick-commerce. Market dynamics emphasize cost-efficient formats, high line-speed manufacturability, and moisture/chemical resistance suited to tropical climates. Companies find lucrative opportunities in sachets for value-seeking consumers, family-size stand-up pouches, refill stations in modern trade, and durable returnable containers for last-mile delivery. Latest trends feature plant-derived resins, water-based inks, and mono-PE/PP structures for improved recyclability, alongside ergonomic closures tailored to compact living. The forecast anticipates robust expansion as governments promote waste reduction and extended producer responsibility, accelerating shifts from multi-material laminates to recycle-ready designs. Recent developments include regional PCR capacity additions, localized pump and trigger production to cut lead times, and smart labels that verify authenticity and provide after-use disposal guidance. Europe Home Care Packaging Market Europe’s market is steered by stringent circular-economy policies, deposit return schemes, and retailer mandates for recyclability and traceability. Market dynamics reward mono-material bottles and pouches, high-PCR content, and refill-at-home or in-store systems that minimize virgin plastic. Lucrative opportunities arise in concentrated formats, fiber-based secondary packaging, compostable films for select applications, and refill cartridges compatible with durable dispensers. Latest trends include harmonized on-pack recycling labels, mass-balance certified materials, and low-carbon packaging verified via lifecycle assessments. The forecast signals sustained transition from single-use to reuse and refill ecosystems, with digital product passports enabling end-to-end material tracking. Recent developments highlight foaming and dosing closures tuned for low-water formulations, PCR odor-neutralization technologies, and lightweight aerosol alternatives that meet propulsion and recyclability targets while maintaining performance. Key Market Insights The home care packaging market is expanding steadily, driven by rising consumer awareness of hygiene and cleanliness. Packaging plays a critical role not only in protecting chemical-based products like detergents and disinfectants but also in improving user convenience with features such as easy-pour bottles, spray triggers, and resealable closures. Sustainability is becoming a dominant trend, with manufacturers increasingly shifting toward recyclable plastics, biodegradable films, and reusable formats. Lightweight packaging and concentrated refill packs are reducing plastic use and aligning with circular economy goals, which are gaining traction among both regulators and consumers. E-commerce growth has significantly influenced packaging design, with a demand for durable, leak-proof, and compact formats that can withstand long-distance shipping. Protective secondary packaging and tamper-evident closures are being widely adopted to ensure safe delivery of home care products ordered online. Innovations in digital printing and smart labeling are enhancing packaging appeal and functionality. QR codes, scannable instructions, and traceability features are being integrated to offer transparency and brand engagement, giving consumers additional information beyond what is printed on the label. Rigid plastics remain widely used for bottles, jerry cans, and dispensers, but flexible packaging such as stand-up pouches and refill packs are gaining rapid popularity. These formats reduce material usage, cut logistics costs, and provide portability, making them ideal for liquid detergents and surface cleaners. Growing demand for eco-friendly packaging has encouraged companies to explore plant-based resins, compostable films, and post-consumer recycled content. This shift is particularly strong in developed markets such as Europe and North America, where regulations and consumer expectations drive sustainable adoption. Convenience features such as ergonomic handles, pump dispensers, and single-dose pods are reshaping packaging design. These features improve ease of use while reducing spillage and waste, appealing to busy households seeking practical solutions for daily cleaning tasks. Asia-Pacific leads the market in terms of volume consumption due to its large population and rising middle-class spending power. In contrast, North America and Europe focus more on premium and sustainable packaging formats, emphasizing recyclability and compliance with strict environmental standards. The rise of private label brands in supermarkets and e-commerce platforms has increased competition, prompting companies to innovate packaging as a differentiator. Unique designs, customized labeling, and eco-certified packaging are helping brands build loyalty in a price-sensitive market. Challenges facing the market include volatile raw material prices for plastics and compliance with evolving environmental regulations. However, opportunities lie in investment in recycling infrastructure, adoption of refillable systems, and collaborations between packaging companies and chemical manufacturers to innovate sustainable solutions.

Published:Mar-2025

Plastic Caps and Closures Market Outlook Report

Plastic Caps and Closures technologies are systems and devices designed to capture, store, and release energy for later use. These technologies enable the storage of electrical, mechanical, thermal, or chemical energy in various forms, allowing for flexibility in energy supply and demand management. Plastic Caps and Closures technologies play a crucial role in enhancing the efficiency, reliability, and resilience of energy systems by mitigating the challenges posed by the intermittent nature of renewable energy sources, managing peak demand, and providing backup power during grid outages. The Plastic Caps and Closures technologies are categorized in to various types such as batteries, pumped hydro storage, thermal Plastic Caps and Closures, Compressed Air Plastic Caps and Closures (CAES), Flywheels and Supercapacitors. Plastic Caps and Closures solutions find applications across various industries, offering solutions to a wide range of challenges related to energy management, grid stability and sustainability. Some of the key end use industries for Plastic Caps and Closures technologies include Renewable Energy Integration, Electric Vehicles (EVs) and Transportation, Utilities and Grid-Scale Storage, Commercial and Industrial (C&I) Applications, Residential Plastic Caps and Closures, Telecommunications and Remote Applications and Defence and Aerospace. Latest Trends Advancements in Solar Plastic Caps and Closures Technologies: Solar energy plays an important role in the world's shift to renewable energy, increasing the demand for solar power storage systems. Solar power storage gives constant access to low-cost energy while also supporting the electric grid. However, the lack of adequate storage systems is projected to constitute a significant problem in reaching the full potential of solar energy. The solar business is experiencing tremendous technological developments that promise to improve solar energy efficiency and accessibility. Technologies such as Perovskite solar cells, bifacial modules, and sophisticated Plastic Caps and Closures technologies are making solar power more competitive as well as expanding its applicability in various sectors. In addition, in 2024, significant developments are expected in solar Plastic Caps and Closures, with enhanced battery technologies and innovative storage systems. The surge in demand for large-scale commercial and industrial Plastic Caps and Closures in 2024 is set to fuel substantial growth in the global Plastic Caps and Closures sector. Furthermore, advanced solar battery storage systems will complement higher-efficiency solar panels. Expansion of large-scale Plastic Caps and Closures: With an increasing trend of commercial and industrial storage system adoption, a major increase in global large-scale Plastic Caps and Closures system deployments is projected by 2024. In terms of installation growth, both domestic and international markets are expected to see an increase in demand. The installation of large-scale Plastic Caps and Closures is expected to exceed the installed capacity of domestic, commercial, and industrial Plastic Caps and Closures. The United States will be a significant demand centre for large-scale storage in 2024. The market is predicted to have a significant desire for Plastic Caps and Closures, driven by a highly efficient and diverse profitability model. However, the United States has a particular difficulty due to poor national grid connectivity, making the need for Plastic Caps and Closures even more essential. As the country's renewable energy potential grows, Plastic Caps and Closures will become increasingly important in maintaining a dependable and resilient grid. DrivingDrivers Increasing Adaption of Renewable Sources: One of the primary drivers of Plastic Caps and Closures market growth is the increasing adoption of renewable energy sources. Solar and wind power installations have proliferated worldwide, but their intermittent nature poses challenges to grid stability. Plastic Caps and Closures systems, including batteries, pumped hydro storage and thermal storage, help mitigate these challenges by storing excess energy during periods of high generation and releasing it when demand exceeds supply. According to the International Renewable Energy Agency (IRENA), the share of total installed renewable capacity in total installed capacity is anticipated to grow from 40% (or 3,382GW) in 2022 to 77% (or 11,174GW) by the end of 2030. Meanwhile, many nations around the world are planned to increase their respective renewable energy capacities in order to achieve complete net zero emissions by 2050. In the recent 18th Group of 20 Nations (G20) Summit held in India in September 2023, all the G20 nations have pledged to triple renewable energy capacity by 2030. Meanwhile, in the latest COP28 summit held in Dubai, around 120 nations including the US and the EU agreed to triple their renewables by 2030. Technological Advancements and R&D: Advancements in battery technologies, particularly lithium-ion batteries, have revolutionized the Plastic Caps and Closures landscape. Factors such as declining costs, improved energy density and enhanced performance characteristics have made batteries a preferred choice for various applications, including grid-scale storage, residential Plastic Caps and Closures and electric vehicles. Market Challenges Higher Costs: One of the significant barriers to the widespread adoption of Plastic Caps and Closures systems is their high initial costs. While the costs of Plastic Caps and Closures technologies, such as lithium-ion batteries, have been declining in recent years, they still represent a significant upfront investment for consumers, businesses, and utilities. The capital-intensive nature of Plastic Caps and Closures projects can deter potential buyers and limit deployment, particularly for grid-scale and large-scale applications. Technology Maturity and Reliability: Many Plastic Caps and Closures technologies like flow battery storage systems are still in the early stages of development, and their performance, reliability, and durability may not be fully proven or optimized. Issues such as battery degradation, cycle life, and safety concerns can impact the economic viability and operational performance of Plastic Caps and Closures systems. Lack of confidence in the reliability and long-term performance of Plastic Caps and Closures technologies can be a deterrent for potential buyers and investors. Companies Mentioned Silgan Holdings Inc. Berry Global Inc. Amcor plc Crown Holdings, Inc. AptarGroup, Inc. *The companies above are listed in no particular order. Report Scope Details Market Value- $ Billion,2024 49,504 Market Growth (Value), (2024-2031)- % 5.5 Leading Region Xx Base Year 2023 Forecast Period 2024 to 2031 Segments Covered By Product Type, By Raw Material, ByContainer Type, By End User Geography Covered North America, Europe, Asia-Pacific,South and Central America, and Middle East & Africa

Published:Jan-2025